How to Calculate Profit Margins for an Underwear Business?
Starting an underwear brand sounds exciting — until you look at the numbers. Most founders I talk to aren’t bad at math. They’re just missing half the costs before they even open a spreadsheet.
To calculate your underwear profit margin, use this formula: Gross Margin = (Retail Price − COGS) ÷ Retail Price. For a DTC underwear brand, a healthy gross margin target is 55–70%. That means on a $28 retail price, your total allowable COGS is roughly $8.40–$12.60 per unit.

This article won’t give you generic e-commerce markup rules. Underwear has a specific cost structure that’s very different from hard goods or accessories. I’ll walk you through the real numbers — from a factory’s point of view.
Demystifying the Formula: A Step-by-Step Guide to Calculating Underwear Profit Margins?
The formula itself isn’t the problem. Most founders have seen it before. The problem is what goes into the "cost" side of the equation.
Gross Margin (%) = (Retail Price − COGS) ÷ Retail Price × 1001. COGS here means your total landed cost per unit — everything you spend to get one finished piece to your warehouse door. Get that number wrong, and the formula gives you false confidence.

Let’s make this concrete. Say you want to sell a pair of underwear at $28 retail and you’re targeting a 60% gross margin. Here’s what that means in reverse:
| Target Gross Margin | Retail Price | Max Allowable COGS |
|---|---|---|
| 55% | $28 | $12.60 |
| 60% | $28 | $11.20 |
| 65% | $28 | $9.80 |
| 70% | $28 | $8.40 |
So if you’re targeting 60% gross margin, your total COGS budget is $11.20 per unit. That includes everything — fabric, labor, packaging, shipping to your warehouse, and every small cost in between.
Now here’s what most founders get wrong. They take a fabric quote from a supplier, add a rough guess for labor, and assume they’re done. That number usually comes in around $5–$7. It feels like plenty of room. But once you add in every real line item, that $11.20 ceiling gets tight fast. Especially at small order volumes.
The formula is simple. Building an honest cost number to put into it — that’s the actual work.
Cost Breakdown 101: Analyzing Material, Manufacturing, and Overhead Expenses?
When new brand clients share their cost assumptions with us, the first thing we check is whether they’ve accounted for trims. Most haven’t. Fabric is visible. Trims are easy to forget — and they add up fast.
Your landed COGS per unit for underwear has at least six components: fabric, trims and accessories, cut-and-sew labor, quality inspection, packaging, and inbound freight. Founders who only price fabric typically underestimate their true COGS by 30–50%, depending on the product.2

Here’s what each line item actually covers — and why each one is easy to miss:
Fabric
This is the biggest cost driver. For knit underwear, fabric is typically priced per kilogram.3 The cost depends on fiber content (modal, cotton, recycled nylon), weight, and your order quantity. Founders often get quoted a price at bulk minimums and use that number for their launch order. That’s the trap — more on this in the next section.
Trims and Accessories
This category includes elastic waistbands, care labels, woven labels, hang tags, hook-and-eye closures (for bralettes), and any decorative hardware. Each item has its own minimum order quantity from the supplier. Each item costs money. A single pair of underwear might have 4–6 trim components. None of them are expensive alone, but together they can add $0.80–$2.00 per unit at small volumes.
Cut-and-Sew Labor
This is what the factory charges to actually make the garment. For basic knit underwear, labor is relatively low compared to woven or tailored garments. But it still needs to be in your cost model as a real line item, not a rounding error.
Quality Inspection
If you’re running AQL-standard inspection (which you should be for any international shipment), there’s a cost.4 It’s either built into the factory price or charged separately by a third-party QC firm. Budget for it either way.
Packaging
Polybag per unit, hang tags, inner boxes, and outer cartons all cost money. Retail packaging — especially if you want a branded unboxing experience — can easily run $0.50–$1.50 per unit at small quantities.
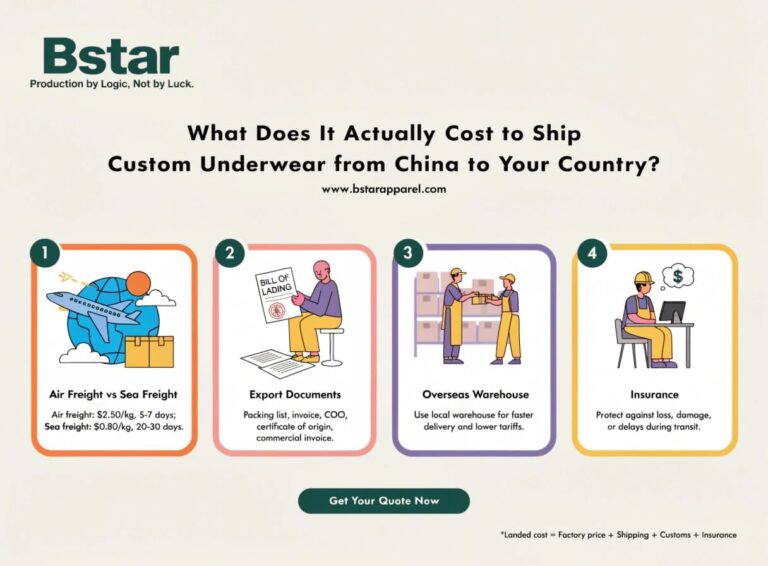
Inbound Freight
Getting your goods from the factory in China to your warehouse in the US or EU is not free. At small volumes, you’re likely air freighting, which is significantly more expensive per unit than sea freight5. This is another cost that small-batch founders systematically underestimate.
| Cost Component | Easy to Miss? | Notes |
|---|---|---|
| Fabric | No | Usually the first quote founders get |
| Trims and accessories | Yes | Multiple SKUs, each with own MOQ |
| Cut-and-sew labor | Partial | Sometimes bundled, easy to undercount |
| Quality inspection | Yes | Often forgotten until it’s a crisis |
| Packaging | Partial | Branded packaging adds cost fast |
| Inbound freight | Yes | Air vs. sea makes a big unit cost difference |
Pricing Strategies for Profit: Balancing Market Demand with Cost Structures?
Here’s the most painful conversation I have with founders. They’ve done their research. They know their target retail price. They have a cost quote from a factory. The numbers look fine — on paper. Then they place their first order and realize the quote they received was for 3,000 units, not 300.
Small-batch production costs significantly more per unit than bulk production. At order quantities of 100–500 pieces, your per-unit COGS can be 30–60% higher than at 3,000+ pieces.6 If you build your retail price around bulk-volume cost assumptions, you will lose money on your launch.

This is the MOQ trap. Let me show you what it looks like with a simplified example.
Before and After: The MOQ Reality Check
| Cost Component | At 3,000 units | At 300 units |
|---|---|---|
| Fabric (per unit) | $3.20 | $4.80 |
| Trims (per unit) | $0.60 | $1.40 |
| Labor (per unit) | $1.80 | $2.40 |
| Packaging (per unit) | $0.50 | $1.10 |
| Freight and inspection | $0.80 | $2.20 |
| Total COGS | $6.90 | $11.90 |
These are illustrative figures for planning reference, not quoted prices. Actual costs vary by product, materials, and supplier.
At 3,000 units, you’re well inside the $11.20 COGS budget for a 60% margin on a $28 retail price. At 300 units, you’ve already blown past it — and your actual gross margin is closer to 57%, assuming you don’t adjust your retail price upward.
That gap is the difference between a viable business and a slow bleed.
The pricing strategy takeaway here is simple. Either price your product based on your actual launch-volume costs, not your dream-scale costs. Or accept that your early batches will run at lower margins and plan your cash flow accordingly.
Optimizing Your Bottom Line: Tactics to Boost Margins Through Efficiency and Pricing?
Getting your margin calculation right is step one. The next question is: how do you improve it? There are two levers — cost and price. Most founders focus only on price. The smarter move is to work both.
You can improve gross margins by reducing per-unit COGS through higher order volumes, smarter material choices, and design simplification — or by increasing retail price through positioning and product differentiation. Both levers matter, and the most effective brands use both at the same time.

On the Cost Side
Consolidate your trim suppliers. Every time you add a new trim component with a new minimum, you add cost and complexity. Simplifying your design reduces trim SKUs and brings down per-unit cost.
Increase volume on your core SKUs. You don’t need to launch 20 styles. Launch three and order more of each. Concentrated volume gets you better pricing on fabric and trims, and keeps production runs efficient.
Choose materials strategically. Modal costs more than cotton. Recycled nylon costs more than virgin nylon.7 That’s not a reason to avoid them — some markets pay a premium for sustainable materials8. But know what you’re paying for and build it into your price.
On the Pricing Side
Know your floor, not just your target. Work backwards from your COGS to the minimum retail price that gives you a viable margin. That number is your floor. Anything below it is a money-losing product.
Don’t forget the costs that erode gross margin. Gross margin is not the money you keep. Before you get to net margin, you’ll lose some of it to returns and exchanges (apparel return rates run high9), platform fees if you’re on Shopify with Meta ads, customer service costs, and import duties and tariffs. These don’t belong in your COGS calculation, but they absolutely belong in your business planning.10 A 60% gross margin that gets eroded by 20+ points of operating costs leaves very little room.
| Gross Margin Erosion Factor | Why It Hits Underwear Brands Hard |
|---|---|
| Returns and exchanges | Fit issues are common; hygiene policies complicate resale11 |
| Import duties and tariffs | Varies by country; can be 5–20%+ of product value |
| Platform and payment fees | Shopify + Meta + payment processing adds up fast |
| Customer service | Size and fit questions drive high contact rates |
Conclusion
Underwear margins aren’t complicated — but they are unforgiving. Get your full cost stack right, price for your real launch volume, and know the difference between gross margin and cash in your pocket.
-
"Gross margin – Wikipedia", https://en.wikipedia.org/wiki/Gross_margin. Gross margin, as defined in standard financial accounting, represents the proportion of revenue retained after deducting the cost of goods sold (COGS); it is expressed as a percentage using the formula (Revenue − COGS) ÷ Revenue × 100, and is widely used as a measure of production and pricing efficiency. Evidence role: definition; source type: encyclopedia. Supports: That gross margin is a standard financial metric calculated as the difference between revenue and cost of goods sold, divided by revenue. Scope note: The definition of COGS varies by accounting framework and business model; for product-level margin analysis in a startup context, the article’s use of ‘landed cost per unit’ as a proxy for COGS is a practical simplification rather than a strict GAAP definition. ↩
-
"Analysis of The Components Affecting Product Cost in Apparel Sector", https://www.researchgate.net/publication/393449675_Analysis_of_The_Components_Affecting_Product_Cost_in_Apparel_Sector. Research into apparel supply chain cost structures indicates that fabric typically represents only a portion of total landed cost, with trims, labor, logistics, and compliance costs collectively comprising a substantial share; the precise underestimation range varies by product category and order volume. Evidence role: statistic; source type: research. Supports: That apparel founders systematically underestimate total landed cost when only accounting for fabric. Scope note: No widely cited academic study appears to have established the specific 30–50% underestimation figure; the claim may reflect practitioner experience rather than published empirical data. ↩
-
"Knit Fabric by Kilogram", https://textilsl.com/why-are-some-fabrics-sold-by-the-kilogram/. In apparel textile sourcing, knit fabrics are conventionally priced per kilogram rather than per linear yard or meter, as the weight-based unit more accurately reflects material cost given variations in fabric width and stretch; this practice is standard in Asian manufacturing hubs including China, Bangladesh, and Sri Lanka. Evidence role: general_support; source type: institution. Supports: That knit fabrics used in underwear and intimate apparel manufacturing are commonly traded and quoted on a per-kilogram basis. Scope note: Pricing conventions may vary by supplier, region, and buyer relationship; some suppliers quote per linear meter or per yard, particularly for narrower or specialty knit constructions. ↩
-
"[PDF] ISO 2859-1 – UNT Chemistry Department", https://chemistry.unt.edu/~tgolden/courses/iso2859-1.pdf. AQL-based sampling inspection is codified in ISO 2859-1 (Sampling procedures for inspection by attributes), which defines acceptance quality limits and sampling plans widely adopted in apparel and consumer goods manufacturing to determine whether a production lot meets specified quality thresholds. Evidence role: definition; source type: institution. Supports: That AQL (Acceptable Quality Limit) inspection is a recognized international standard used for quality sampling in manufacturing and import contexts. Scope note: ISO 2859-1 defines the statistical framework; the specific AQL level selected (e.g., 1.5, 2.5, 4.0) and the inspection scope are determined by the buyer and may vary by product risk level. ↩
-
"Air Freight vs. Sea Freight for Apparel Shipments", https://capitalworldgroup.com/air-freight-vs-sea-freight/. Freight rate data from logistics industry sources consistently show that air cargo rates per kilogram are several times higher than ocean freight rates on equivalent trade lanes; for low-value, high-volume goods such as apparel, this differential can make air freight economically prohibitive except for small or time-sensitive shipments. Evidence role: statistic; source type: institution. Supports: That air freight costs substantially more per kilogram than ocean freight for goods shipped from Asia to North America or Europe. Scope note: The precise cost multiple between air and sea freight varies with fuel prices, capacity constraints, and seasonal demand; the figures cited in logistics industry reports represent averages and may not reflect rates available to small-volume shippers. ↩
-
"Minimum Order Quantities Explained: Why They Matter in Custom …", https://oss-apparel.com/minimum-order-quantities-for-custom-apparel/. Economies of scale in apparel manufacturing are well documented; fixed setup costs, fabric minimums, and trim MOQs are spread across fewer units at low volumes, resulting in materially higher per-unit costs compared to bulk production runs. Evidence role: mechanism; source type: research. Supports: That per-unit production costs decrease significantly as order volumes increase due to fixed cost spreading and supplier pricing tiers. Scope note: The specific 30–60% range is illustrative and will vary considerably by factory, product complexity, and material sourcing; no single published source establishes this precise band for knit underwear. ↩
-
"Modal Fabric vs Cotton: Key Points to Consider – 2023", https://wellfabric.com/modal-fabric-vs-cotton-fabric/. Textile industry analyses indicate that specialty cellulosic fibers such as modal command a price premium over commodity cotton due to higher processing costs, while mechanically or chemically recycled nylon typically costs more than virgin nylon owing to collection, sorting, and reprocessing expenses. Evidence role: general_support; source type: research. Supports: That modal and recycled synthetic fibers carry a price premium over conventional cotton and virgin nylon respectively. Scope note: Fiber price differentials fluctuate with commodity markets, energy costs, and supply chain conditions; the premium for recycled or specialty fibers may narrow or widen depending on market timing and supplier relationships. ↩
-
"[PDF] A Systematic Literature Review on Consumer Willingness to Pay for …", https://scholarworks.uark.edu/cgi/viewcontent.cgi?article=7286&context=etd. Multiple consumer surveys, including research published by McKinsey & Company and Nielsen, have found that a meaningful share of consumers—particularly younger demographics—report willingness to pay a premium for sustainably produced apparel, though stated preferences do not always translate to purchase behavior. Evidence role: expert_consensus; source type: research. Supports: That a segment of consumers demonstrates willingness to pay higher prices for apparel made from sustainable or recycled materials. Scope note: Willingness-to-pay findings from surveys frequently overstate actual purchase behavior; the premium achievable in practice depends heavily on brand positioning, product category, and target market. ↩
-
"E-commerce returns in the United States – statistics & facts – Statista", https://www.statista.com/topics/10716/e-commerce-returns-in-the-united-states/?srsltid=AfmBOoq_Gcmpm9W38J-g9UIoqrgbF7W3WxQwHoE8WJKWhmTsZeRuM5zt. Industry analyses of e-commerce return rates consistently identify apparel as one of the highest-return categories, with estimates frequently ranging from 20–40% of online orders, driven primarily by fit and sizing issues. Evidence role: statistic; source type: institution. Supports: That apparel has among the highest return rates in e-commerce retail. Scope note: Return rate figures vary significantly by channel, price point, and brand; aggregate industry estimates may not reflect the specific experience of a direct-to-consumer underwear startup. ↩
-
"Operating Expenses vs. COGS: Key Differences Explained", https://www.investopedia.com/ask/answers/101314/what-are-differences-between-operating-expenses-and-cost-goods-sold-cogs.asp. Under generally accepted accounting principles (GAAP), cost of goods sold encompasses direct costs attributable to the production of goods sold, while selling, general, and administrative expenses (SG&A)—including advertising, platform fees, and customer service—are recorded separately as operating expenses, reducing operating income below the gross profit line. Evidence role: definition; source type: encyclopedia. Supports: That advertising, platform fees, and customer service costs are classified as operating expenses (SG&A) rather than cost of goods sold under standard accounting frameworks. Scope note: The precise classification of certain costs (e.g., inbound freight, fulfillment) can vary by company accounting policy; the article’s treatment reflects a product-level margin analysis rather than a formal income statement presentation. ↩
-
"NY State Assembly Bill 2009-A10635 – NYS Senate", https://www.nysenate.gov/legislation/bills/2009/a10635. Consumer protection regulations in several jurisdictions, including EU Directive 2011/83/EU on consumer rights, permit retailers to exclude intimate apparel from standard return rights on hygiene grounds when the protective seal has been removed, effectively preventing resale of returned units and converting returns into a direct cost. Evidence role: general_support; source type: government. Supports: That hygiene considerations create legal or policy barriers to reselling returned underwear, increasing the effective cost of returns for brands. Scope note: Applicable hygiene exemptions vary by jurisdiction and are subject to interpretation; not all markets provide a clear statutory basis for refusing returns of unsealed intimate apparel, and brand return policies may be more restrictive than legally required. ↩